Coheron - Personal Observability System
What it is
Most self-tracking tools reduce complex human state to flat metrics — steps, mood scores, time logs. That creates dimensional collapse: important structure is lost and signals become misleading.
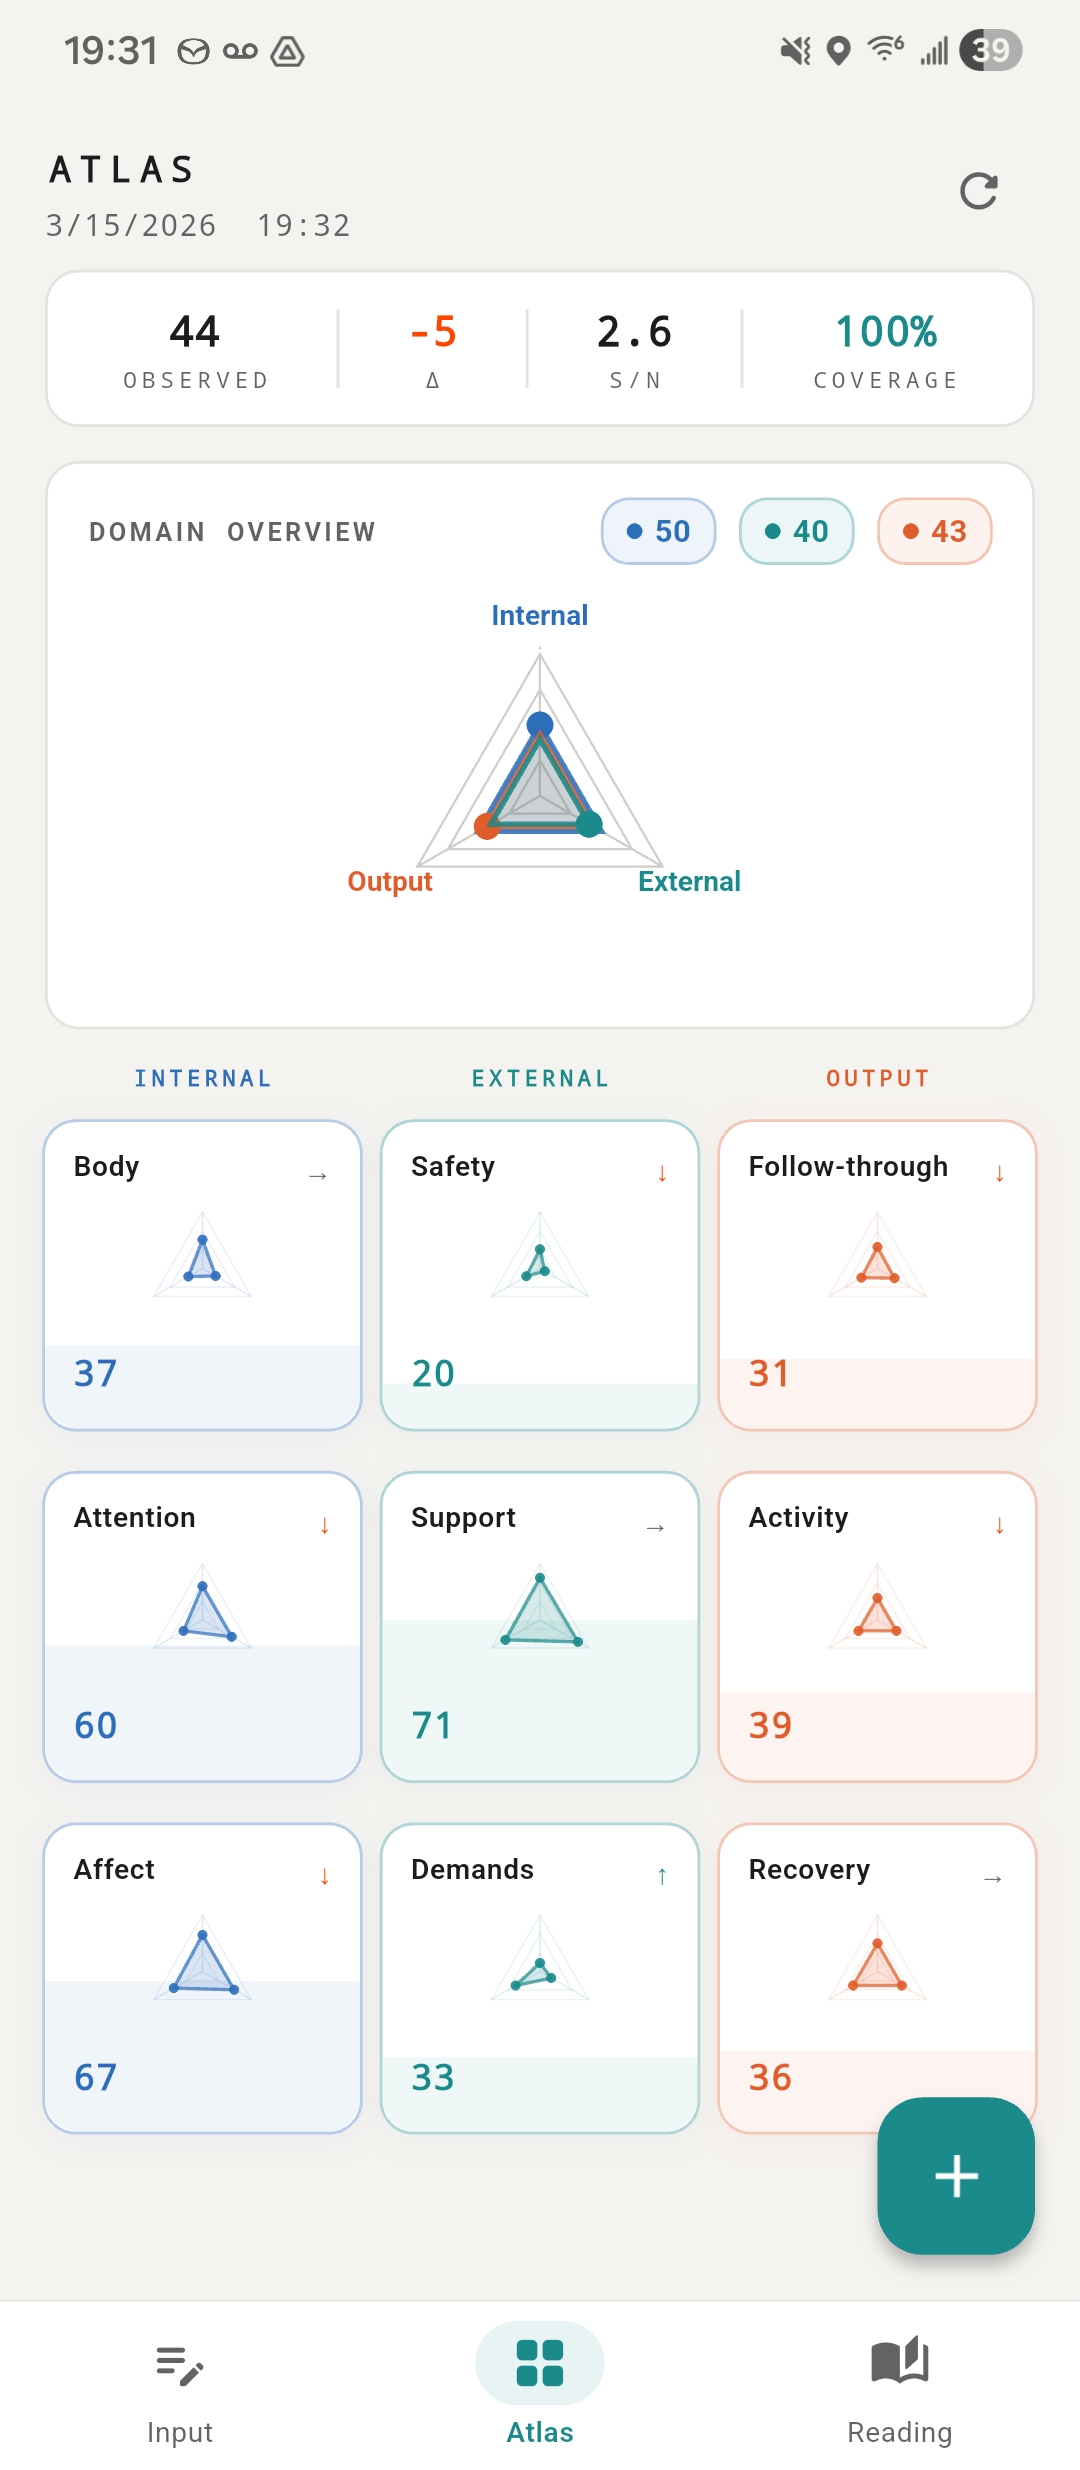
Coheron models state as a three-domain system:
- Internal — physiological and psychological state (Rest, Pain, Energy, Focus, Mood, Drive, …)
- External — environment and constraints (Safety, Barriers, Support, Demands, Money, Time, …)
- Output — behavior and actions (Follow-through, Reactivity, Activity, Rhythm, Recovery, …)
Each domain decomposes into Planes, each Plane into Indicators. The full structure is Domain → Plane → Indicator.
Four views
- Atlas — aggregate system state rendered as a field-based visualization (Gaussian density, contour)
- Input — direct manipulation of domain, plane, and indicator values
- Readings — change tracking and relative movement between sessions
- Graph — temporal trends across domains and signals
Current state
Core taxonomy, Atlas visualization, and APK builds are working. Input UI and persistence have known bugs in progress.
What This Demonstrates
- Structured observability model applied to personal state (not just logging)
- Field-based visualization (Gaussian/contour) over standard bar/line charts
- Domain → Plane → Indicator decomposition preserving multi-dimensional structure
- Local-first Flutter architecture with no cloud dependency