I made this because I really enjoy math.
What has changed for me is thinking of it as a way of objective description. You can name a relationship, say what you are holding fixed, and work through what follows when something changes. That has opened math up in a way I find difficult to leave alone.
A rate describes how one quantity changes with another. A set describes which things satisfy a condition. Probability gives us ways to reason about uncertainty. With the relevant information and assumptions, we can update probabilities and make more specific statements about what we know.
There is something lovely about that. An expression can hold a relationship still long enough for you to examine it.
I wanted to build a place where I could do that examination with my hands as well as my eyes.
A variable should have a place
The project is called the Mathematical Expression Atlas. I’ve also been calling it Mathcards.
The basic idea is a story, a formula, and a visual that all describe the same situation. Change a variable in the story and follow it into the calculation. Then see exactly where it changes the shape, the graph, or the relationship between the objects on screen.
The first versions made something clear: watching a number change left me wanting more information. I wanted another cue. If an area grows, let it occupy more space. If a direction changes, let the arrow turn. If two nearly identical starting values separate, let me follow their paths.
That is the experience I’m trying to build. I want to be curious about moving a slider because I have a question about what will happen.
The readings also need time to be read. The visuals can move smoothly while the numbers update at a calmer pace. A useful animation should give me something to notice.
One crate, two averages
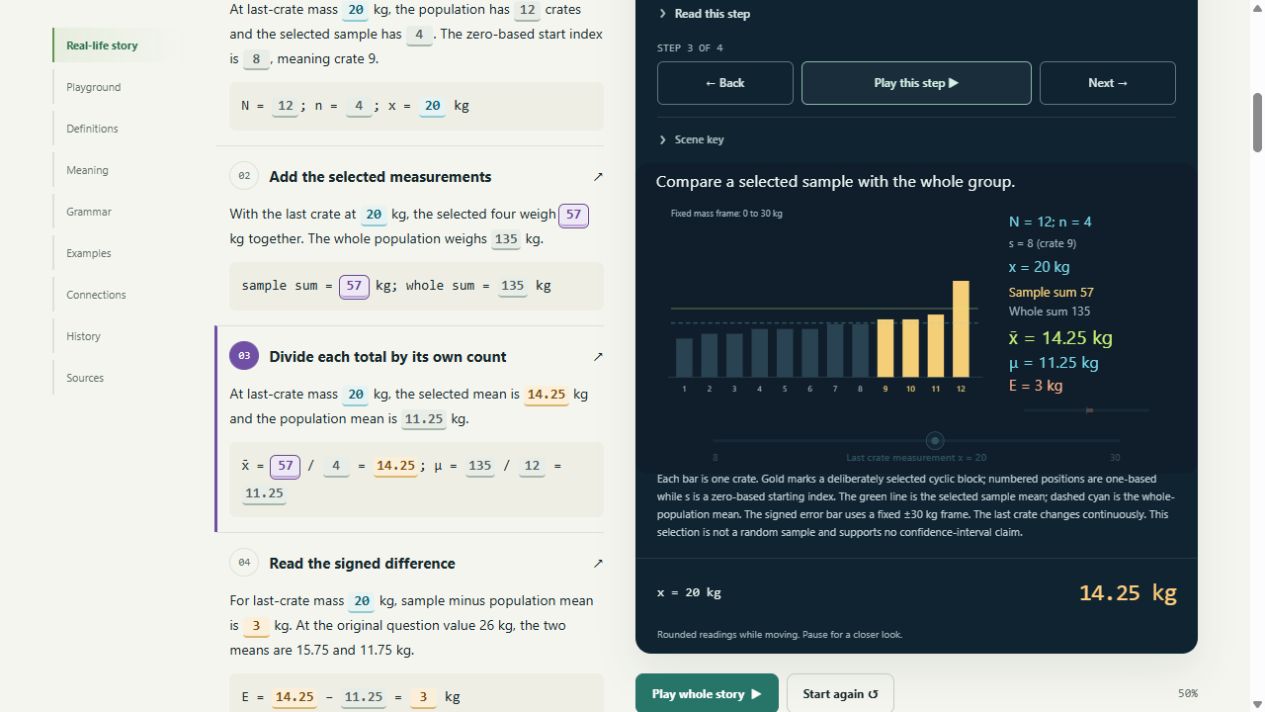
One of the current lessons uses twelve crate weights. Four selected crates weigh 12, 12, 13, and 14 kg. Their total is 51 kg, so their mean is:
51 ÷ 4 = 12.75 kg
All twelve crates weigh 129 kg together. Their mean is:
129 ÷ 12 = 10.75 kg
Now move that last crate’s weight from 14 kg to 26 kg. The selected group gains twelve kilograms, and so does the whole population. The selected mean becomes 15.75 kg. The population mean becomes 11.75 kg.
The same change appears in both calculations, but one divides it among four observations and the other among twelve. On the screen, the highlighted bar grows and the two mean lines move by different amounts.
The calculation is small. What interests me is how much it says once the selection, counts, and measurements are visible together.
This group of four was deliberately chosen. Its mean describes those four crates. Keeping the full population beside it lets me inspect how the selection affects the description. That gives the lesson a useful boundary: a difference between two means does not, by itself, tell me the uncertainty of an estimate.
Precision makes the questions better
That boundary is part of what I’m enjoying about math.
An expression can be precise while the model still leaves something out. The choice of measurements, variables, and conditions matters. I want the atlas to make those choices easier to inspect.
In the probability lessons, that means following both the event of interest and the other ways an observation could occur. One example uses a factory flag that can come from a real defect or a false alarm. Bayes’s rule connects the starting probabilities and those two routes into the probability of a defect among flagged parts. Changing an assumption changes what follows from the model.
In a gradient lesson, height, slope, direction, and magnitude each need their own meaning. In the tangent-plane lesson, the predicted height stays beside the actual height, with the error drawn where it occurs.
Those distinctions help me ask a more useful question. Which quantity am I looking at? What did I assume? Which input could change this conclusion?
I find that much more engaging than a result sitting on its own.
Give the ideas somewhere to meet
The atlas map is there because the ideas connect. A gradient uses partial derivatives and vectors. Comparing a sample with its population involves collections, sums, division, and the meaning of a measurement. A scan through a list connects an algorithm’s rule to its work count and a chosen model of time.
There is also a searchable reference for the words and symbols. If a symbol stops me, I want to be able to look it up and return to the card that uses it. The reference should support the exploration without requiring me to arrive already fluent in its language.
I’m keeping the construction modular for the same reason. The mathematical model, story, visual, and definition are separate parts that share one playground. There is still a lot of front-end design to do. I want room to make the experience more alive while keeping each lesson understandable.
It is a working prototype, and the lessons are still drafts. The reason I keep expanding it is the pleasure of seeing an idea become clear enough to move around.
I keep coming back to the same small pleasure: moving one thing and understanding why something else changes.
It’s lovely.
Explore the Mathematical Expression Atlas, open the playground, or look through the source.
Comments – Addendum Notes
Sign in with GitHub to comment or reply. Comments live as GitHub Discussions on the site repo — no ppeck.me account needed.